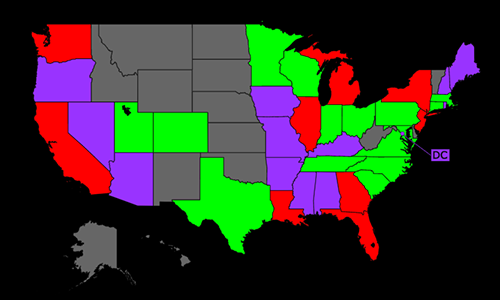
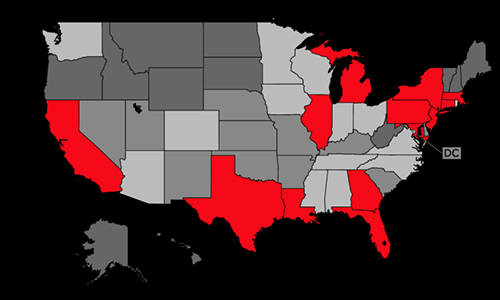
HEALTH RANKINGS Pennsylvania

AGE-STANDARDIZED DEATH RATE: CDC 12/22
PER 100,000 POPULATION
GOOD
POOR
| CAUSES OF DEATH | Rate | USA Rank | |
| 1. | COVID-19 |
102.51
|
25
|
| 2. | Coronary Heart Disease |
94.10
|
23
|
| 3. | Poisonings |
41.66
|
12
|
| 4. | Stroke |
37.66
|
30
|
| 5. | Lung Cancers |
33.32
|
22
|
| 6. | Lung Disease |
29.14
|
40
|
| 7. | Diabetes Mellitus |
23.52
|
37
|
| 8. | Alzheimers |
22.71
|
43
|
| 9. | Hypertension |
21.33
|
43
|
| 10. | Breast Cancer |
19.59
|
29
|
| 11. | Prostate Cancer |
19.07
|
35
|
| 12. | Kidney Disease |
17.40
|
12
|
| 13. | Endocrine Disorders |
15.58
|
25
|
| 14. | Suicide |
13.94
|
37
|
| 15. | Falls |
13.42
|
20
|
| 16. | Colon-Rectum Cancers |
13.37
|
29
|
| 17. | Pancreas Cancer |
12.25
|
9
|
| 18. | Liver Disease |
10.98
|
44
|
| 19. | Influenza & Pneumonia |
10.36
|
25
|
| 20. | Parkinson's Disease |
9.46
|
36
|
| CAUSES OF DEATH | Rate | USA Rank | |
| 21. | Inflammatory/Heart |
9.26
|
6
|
| 22. | Homicide |
9.17
|
18
|
| 23. | Lymphomas |
8.84
|
22
|
| 24. | Liver Cancer |
6.73
|
23
|
| 25. | Leukemia |
5.98
|
28
|
| 26. | Ovary Cancer |
5.78
|
35
|
| 27. | Uterin Cancer |
5.73
|
12
|
| 28. | Bladder Cancer |
4.71
|
12
|
| 29. | Other Neoplasms |
4.66
|
14
|
| 30. | Oesophagus Cancer |
4.18
|
21
|
| 31. | Alcohol |
3.19
|
43
|
| 32. | Congenital Anomalies |
3.15
|
30
|
| 33. | Skin Cancers |
3.03
|
36
|
| 34. | Oral Cancer |
2.78
|
27
|
| 35. | Stomach Cancer |
2.46
|
29
|
| 36. | Cervical Cancer |
2.03
|
24
|
| 37. | Low Birth Weight |
1.79
|
14
|
| 38. | Drownings |
0.93
|
38
|
| 39. | HIV/AIDS |
0.66
|
32
|
| 40. | Drug Use |
0.65
|
35
|

PERCENT TOP 50 CAUSES: CDC 12/22
| CAUSES OF DEATH | Deaths | % | |
| 1. | COVID-19 |
18,163
|
16.12
|
| 2. | Coronary Heart Disease |
17,027
|
15.11
|
| 3. | Stroke |
6,765
|
6.00
|
| 4. | Lung Cancers |
6,176
|
5.48
|
| 5. | Lung Disease |
5,353
|
4.75
|
| 6. | Poisonings |
5,230
|
4.64
|
| 7. | Diabetes Mellitus |
4,174
|
3.70
|
| 8. | Alzheimers |
4,105
|
3.64
|
| 9. | Hypertension |
3,806
|
3.38
|
| 10. | Kidney Disease |
3,118
|
2.77
|
| 11. | Endocrine Disorders |
2,682
|
2.38
|
| 12. | Falls |
2,391
|
2.12
|
| 13. | Colon-Rectum Cancers |
2,371
|
2.10
|
| 14. | Pancreas Cancer |
2,247
|
1.99
|
| 15. | Breast Cancer |
1,912
|
1.70
|
| 16. | Suicide |
1,885
|
1.67
|
| 17. | Influenza & Pneumonia |
1,836
|
1.63
|
| 18. | Liver Disease |
1,823
|
1.62
|
| 19. | Parkinson's Disease |
1,685
|
1.50
|
| 20. | Lymphomas |
1,589
|
1.41
|
| 21. | Inflammatory/Heart |
1,584
|
1.41
|
| 22. | Prostate Cancer |
1,442
|
1.28
|
| 23. | Road Traffic Accidents |
1,358
|
1.21
|
| 24. | Other Injuries |
1,306
|
1.16
|
| 25. | Liver Cancer |
1,242
|
1.10
|
| CAUSES OF DEATH | Deaths | % | |
| 26. | Homicide |
1,092
|
0.97
|
| 27. | Leukemia |
1,055
|
0.94
|
| 28. | Bladder Cancer |
845
|
0.75
|
| 29. | Other Neoplasms |
802
|
0.71
|
| 30. | Malnutrition |
767
|
0.68
|
| 31. | Oesophagus Cancer |
764
|
0.68
|
| 32. | Uterin Cancer |
577
|
0.51
|
| 33. | Ovary Cancer |
562
|
0.50
|
| 34. | Skin Cancers |
529
|
0.47
|
| 35. | Alcohol |
500
|
0.44
|
| 36. | Oral Cancer |
491
|
0.44
|
| 37. | Stomach Cancer |
429
|
0.38
|
| 38. | Congenital Anomalies |
373
|
0.33
|
| 39. | Diarrhoeal diseases |
292
|
0.26
|
| 40. | Skin Disease |
282
|
0.25
|
| 41. | Multiple Sclerosis |
230
|
0.20
|
| 42. | Anaemia |
206
|
0.18
|
| 43. | Low Birth Weight |
163
|
0.14
|
| 44. | Rheumatic/Heart |
156
|
0.14
|
| 45. | Cervical Cancer |
148
|
0.13
|
| 46. | Peptic Ulcer Disease |
148
|
0.13
|
| 47. | Fires |
144
|
0.13
|
| 48. | Asthma |
131
|
0.12
|
| 49. | Epilepsy |
119
|
0.11
|
| 50. | HIV/AIDS |
101
|
0.09
|

AGE-STANDARDIZED DEATH RATE: CDC 12/22
PER 100,000 POPULATION
GOOD
POOR
| Rate | USA Rank | ||
| 1. | Lung Cancers |
33.32
|
22
|
| 2. | Breast Cancer |
19.59
|
29
|
| 3. | Prostate Cancer |
19.07
|
35
|
| 4. | Colon-Rectum Cancers |
13.37
|
29
|
| 5. | Pancreas Cancer |
12.25
|
9
|
| 6. | Lymphomas |
8.84
|
22
|
| 7. | Liver Cancer |
6.73
|
23
|
| 8. | Leukemia |
5.98
|
28
|
| Rate | USA Rank | ||
| 9. | Ovary Cancer |
5.78
|
35
|
| 10. | Uterin Cancer |
5.73
|
12
|
| 11. | Bladder Cancer |
4.71
|
12
|
| 12. | Oesophagus Cancer |
4.18
|
21
|
| 13. | Skin Cancers |
3.03
|
36
|
| 14. | Oral Cancer |
2.78
|
27
|
| 15. | Stomach Cancer |
2.46
|
29
|
| 16. | Cervical Cancer |
2.03
|
24
|
DEATH RATE HISTORY SELECTED CAUSES

| Date | Rate | Total | Population |
| 1999 | 281.65 | 41,707 | 12,263,805 |
| 2000 | 271.91 | 40,708 | 12,281,054 |
| 2001 | 261.12 | 39,438 | 12,298,970 |
| 2002 | 254.65 | 38,852 | 12,331,031 |
| 2003 | 246.24 | 38,075 | 12,374,658 |
| 2004 | 233.83 | 36,434 | 12,410,722 |
| 2005 | 229.30 | 36,207 | 12,449,990 |
| 2006 | 210.35 | 33,744 | 12,510,809 |
| 2007 | 201.34 | 32,862 | 12,563,937 |
| 2008 | 201.82 | 33,308 | 12,612,285 |
| 2009 | 193.80 | 32,297 | 12,666,858 |
| 2010 | 187.04 | 31,556 | 12,702,379 |
| 2011 | 185.89 | 31,934 | 12,742,886 |
| 2012 | 177.71 | 30,952 | 12,763,536 |
| 2013 | 178.98 | 31,629 | 12,773,801 |
| 2014 | 175.77 | 31,353 | 12,787,209 |
| 2015 | 177.84 | 32,042 | 12,802,503 |
| 2016 | 176.20 | 31,990 | 12,784,227 |
| 2017 | 176.03 | 32,312 | 12,805,537 |
| 2018 | 176.08 | 32,768 | 12,807,060 |
| 2019 | 172.91 | 32,299 | 12,801,989 |
| 2020 | 175.73 | 32,936 | 12,783,254 |
| 2021 | 180.61 | 32,478 | 12,964,056 |

| Date | Rate | Total | Population |
| 1999 | 209.52 | 30,312 | 12,263,805 |
| 2000 | 207.02 | 30,161 | 12,281,054 |
| 2001 | 204.40 | 29,914 | 12,298,970 |
| 2002 | 201.94 | 29,849 | 12,331,031 |
| 2003 | 199.97 | 29,841 | 12,374,658 |
| 2004 | 196.05 | 29,424 | 12,410,722 |
| 2005 | 195.57 | 29,616 | 12,449,990 |
| 2006 | 190.50 | 29,172 | 12,510,809 |
| 2007 | 186.93 | 29,014 | 12,563,937 |
| 2008 | 184.69 | 28,964 | 12,612,285 |
| 2009 | 182.51 | 28,881 | 12,666,858 |
| 2010 | 181.64 | 29,055 | 12,702,379 |
| 2011 | 177.96 | 28,895 | 12,742,886 |
| 2012 | 175.51 | 28,909 | 12,763,536 |
| 2013 | 170.63 | 28,512 | 12,773,801 |
| 2014 | 169.62 | 28,692 | 12,787,209 |
| 2015 | 167.20 | 28,697 | 12,802,503 |
| 2016 | 164.74 | 28,492 | 12,784,227 |
| 2017 | 161.04 | 28,387 | 12,805,537 |
| 2018 | 156.60 | 28,023 | 12,807,060 |
| 2019 | 153.45 | 27,746 | 12,801,989 |
| 2020 | 153.23 | 27,955 | 12,783,254 |
| 2021 | 152.95 | 27,664 | 12,964,056 |

| Date | Rate | Total | Population |
| 1999 | 57.48 | 8,600 | 12,263,805 |
| 2000 | 58.98 | 8,919 | 12,281,054 |
| 2001 | 56.36 | 8,619 | 12,298,970 |
| 2002 | 55.55 | 8,579 | 12,331,031 |
| 2003 | 52.80 | 8,261 | 12,374,658 |
| 2004 | 49.56 | 7,792 | 12,410,722 |
| 2005 | 48.03 | 7,650 | 12,449,990 |
| 2006 | 44.21 | 7,151 | 12,510,809 |
| 2007 | 43.43 | 7,152 | 12,563,937 |
| 2008 | 41.94 | 6,942 | 12,612,285 |
| 2009 | 40.71 | 6,842 | 12,666,858 |
| 2010 | 39.31 | 6,701 | 12,702,379 |
| 2011 | 39.60 | 6,825 | 12,742,886 |
| 2012 | 37.40 | 6,546 | 12,763,536 |
| 2013 | 37.21 | 6,604 | 12,773,801 |
| 2014 | 36.72 | 6,576 | 12,787,209 |
| 2015 | 38.79 | 6,987 | 12,802,503 |
| 2016 | 36.96 | 6,730 | 12,784,227 |
| 2017 | 36.48 | 6,700 | 12,805,537 |
| 2018 | 35.28 | 6,599 | 12,807,060 |
| 2019 | 35.34 | 6,658 | 12,801,989 |
| 2020 | 36.68 | 6,940 | 12,783,254 |
| 2021 | 37.66 | 6,775 | 12,964,056 |

| Date | Rate | Total | Population |
| 1999 | 41.06 | 6,141 | 12,263,805 |
| 2000 | 40.33 | 6,079 | 12,281,054 |
| 2001 | 38.57 | 5,845 | 12,298,970 |
| 2002 | 39.33 | 6,017 | 12,331,031 |
| 2003 | 39.20 | 6,046 | 12,374,658 |
| 2004 | 38.62 | 5,978 | 12,410,722 |
| 2005 | 39.28 | 6,149 | 12,449,990 |
| 2006 | 35.60 | 5,621 | 12,510,809 |
| 2007 | 38.08 | 6,077 | 12,563,937 |
| 2008 | 41.95 | 6,767 | 12,612,285 |
| 2009 | 39.56 | 6,432 | 12,666,858 |
| 2010 | 37.93 | 6,202 | 12,702,379 |
| 2011 | 39.73 | 6,627 | 12,742,886 |
| 2012 | 38.75 | 6,550 | 12,763,536 |
| 2013 | 39.28 | 6,716 | 12,773,801 |
| 2014 | 36.98 | 6,422 | 12,787,209 |
| 2015 | 38.06 | 6,664 | 12,802,503 |
| 2016 | 36.82 | 6,523 | 12,784,227 |
| 2017 | 37.09 | 6,667 | 12,805,537 |
| 2018 | 35.09 | 6,432 | 12,807,060 |
| 2019 | 34.22 | 6,341 | 12,801,989 |
| 2020 | 32.84 | 6,132 | 12,783,254 |
| 2021 | 30.33 | 5,552 | 12,964,056 |

| Date | Rate | Total | Population |
| 1999 | 35.27 | 4,614 | 12,263,805 |
| 2000 | 35.24 | 4,583 | 12,281,054 |
| 2001 | 34.60 | 4,552 | 12,298,970 |
| 2002 | 35.90 | 4,728 | 12,331,031 |
| 2003 | 37.91 | 5,014 | 12,374,658 |
| 2004 | 39.11 | 5,200 | 12,410,722 |
| 2005 | 40.79 | 5,446 | 12,449,990 |
| 2006 | 39.47 | 5,299 | 12,510,809 |
| 2007 | 40.78 | 5,568 | 12,563,937 |
| 2008 | 42.07 | 5,787 | 12,612,285 |
| 2009 | 39.43 | 5,477 | 12,666,858 |
| 2010 | 41.13 | 5,751 | 12,702,379 |
| 2011 | 44.36 | 6,216 | 12,742,886 |
| 2012 | 44.97 | 6,334 | 12,763,536 |
| 2013 | 44.93 | 6,359 | 12,773,801 |
| 2014 | 46.80 | 6,640 | 12,787,209 |
| 2015 | 51.98 | 7,324 | 12,802,503 |
| 2016 | 61.84 | 8,410 | 12,784,227 |
| 2017 | 70.16 | 9,527 | 12,805,537 |
| 2018 | 61.92 | 8,585 | 12,807,060 |
| 2019 | 61.22 | 8,596 | 12,801,989 |
| 2020 | 69.04 | 9,565 | 12,783,254 |
| 2021 | 73.53 | 10,327 | 12,964,056 |

| Date | Rate | Total | Population |
| 1999 | 25.53 | 3,742 | 12,263,805 |
| 2000 | 25.80 | 3,794 | 12,281,054 |
| 2001 | 25.86 | 3,826 | 12,298,970 |
| 2002 | 24.81 | 3,708 | 12,331,031 |
| 2003 | 24.75 | 3,732 | 12,374,658 |
| 2004 | 23.59 | 3,579 | 12,410,722 |
| 2005 | 23.15 | 3,553 | 12,449,990 |
| 2006 | 22.30 | 3,466 | 12,510,809 |
| 2007 | 21.92 | 3,442 | 12,563,937 |
| 2008 | 20.83 | 3,313 | 12,612,285 |
| 2009 | 20.29 | 3,254 | 12,666,858 |
| 2010 | 19.96 | 3,242 | 12,702,379 |
| 2011 | 21.09 | 3,462 | 12,742,886 |
| 2012 | 22.26 | 3,735 | 12,763,536 |
| 2013 | 22.63 | 3,804 | 12,773,801 |
| 2014 | 22.03 | 3,765 | 12,787,209 |
| 2015 | 22.09 | 3,777 | 12,802,503 |
| 2016 | 20.32 | 3,560 | 12,784,227 |
| 2017 | 21.05 | 3,704 | 12,805,537 |
| 2018 | 20.17 | 3,603 | 12,807,060 |
| 2019 | 20.37 | 3,654 | 12,801,989 |
| 2020 | 23.61 | 4,250 | 12,783,254 |
| 2021 | 23.52 | 4,176 | 12,964,056 |

| Date | Rate | Total | Population |
| 1999 | 14.42 | 2,192 | 12,263,805 |
| 2000 | 16.46 | 2,542 | 12,281,054 |
| 2001 | 17.62 | 2,753 | 12,298,970 |
| 2002 | 17.83 | 2,823 | 12,331,031 |
| 2003 | 18.32 | 2,952 | 12,374,658 |
| 2004 | 20.18 | 3,277 | 12,410,722 |
| 2005 | 20.72 | 3,429 | 12,449,990 |
| 2006 | 19.58 | 3,311 | 12,510,809 |
| 2007 | 20.34 | 3,505 | 12,563,937 |
| 2008 | 22.08 | 3,863 | 12,612,285 |
| 2009 | 20.01 | 3,547 | 12,666,858 |
| 2010 | 20.03 | 3,591 | 12,702,379 |
| 2011 | 19.12 | 3,496 | 12,742,886 |
| 2012 | 18.90 | 3,505 | 12,763,536 |
| 2013 | 17.41 | 3,271 | 12,773,801 |
| 2014 | 18.29 | 3,486 | 12,787,209 |
| 2015 | 20.96 | 4,012 | 12,802,503 |
| 2016 | 21.69 | 4,185 | 12,784,227 |
| 2017 | 21.66 | 4,213 | 12,805,537 |
| 2018 | 20.68 | 4,064 | 12,807,060 |
| 2019 | 21.16 | 4,150 | 12,801,989 |
| 2020 | 23.18 | 4,544 | 12,783,254 |
| 2021 | 22.71 | 4,109 | 12,964,056 |

| Date | Rate | Total | Population |
| 1999 | 20.93 | 3,116 | 12,263,805 |
| 2000 | 20.32 | 3,069 | 12,281,054 |
| 2001 | 17.86 | 2,735 | 12,298,970 |
| 2002 | 19.08 | 2,957 | 12,331,031 |
| 2003 | 19.20 | 3,010 | 12,374,658 |
| 2004 | 18.57 | 2,938 | 12,410,722 |
| 2005 | 19.17 | 3,068 | 12,449,990 |
| 2006 | 16.54 | 2,716 | 12,510,809 |
| 2007 | 15.48 | 2,555 | 12,563,937 |
| 2008 | 16.27 | 2,705 | 12,612,285 |
| 2009 | 15.62 | 2,601 | 12,666,858 |
| 2010 | 13.64 | 2,324 | 12,702,379 |
| 2011 | 15.97 | 2,771 | 12,742,886 |
| 2012 | 13.47 | 2,360 | 12,763,536 |
| 2013 | 16.16 | 2,884 | 12,773,801 |
| 2014 | 14.21 | 2,541 | 12,787,209 |
| 2015 | 15.89 | 2,899 | 12,802,503 |
| 2016 | 13.86 | 2,491 | 12,784,227 |
| 2017 | 14.59 | 2,718 | 12,805,537 |
| 2018 | 15.51 | 2,887 | 12,807,060 |
| 2019 | 13.41 | 2,483 | 12,801,989 |
| 2020 | 12.87 | 2,368 | 12,783,254 |
| 2021 | 10.33 | 1,844 | 12,964,056 |

| Date | Rate | Total | Population |
| 1999 | 18.01 | 2,680 | 12,263,805 |
| 2000 | 17.84 | 2,677 | 12,281,054 |
| 2001 | 18.73 | 2,838 | 12,298,970 |
| 2002 | 19.25 | 2,944 | 12,331,031 |
| 2003 | 19.47 | 3,013 | 12,374,658 |
| 2004 | 19.71 | 3,067 | 12,410,722 |
| 2005 | 19.78 | 3,108 | 12,449,990 |
| 2006 | 19.27 | 3,084 | 12,510,809 |
| 2007 | 18.31 | 2,965 | 12,563,937 |
| 2008 | 19.16 | 3,138 | 12,612,285 |
| 2009 | 18.43 | 3,054 | 12,666,858 |
| 2010 | 17.81 | 2,982 | 12,702,379 |
| 2011 | 16.80 | 2,873 | 12,742,886 |
| 2012 | 15.83 | 2,736 | 12,763,536 |
| 2013 | 15.74 | 2,767 | 12,773,801 |
| 2014 | 15.74 | 2,798 | 12,787,209 |
| 2015 | 16.86 | 3,021 | 12,802,503 |
| 2016 | 15.73 | 2,813 | 12,784,227 |
| 2017 | 15.88 | 2,898 | 12,805,537 |
| 2018 | 15.79 | 2,921 | 12,807,060 |
| 2019 | 15.97 | 2,975 | 12,801,989 |
| 2020 | 15.58 | 2,916 | 12,783,254 |
| 2021 | 16.84 | 3,027 | 12,964,056 |

| Date | Rate | Total | Population |
| 1999 | 17.35 | 2,545 | 12,263,805 |
| 2000 | 17.41 | 2,588 | 12,281,054 |
| 2001 | 17.73 | 2,649 | 12,298,970 |
| 2002 | 17.03 | 2,566 | 12,331,031 |
| 2003 | 16.19 | 2,471 | 12,374,658 |
| 2004 | 16.26 | 2,491 | 12,410,722 |
| 2005 | 16.46 | 2,548 | 12,449,990 |
| 2006 | 15.72 | 2,466 | 12,510,809 |
| 2007 | 15.68 | 2,479 | 12,563,937 |
| 2008 | 15.24 | 2,438 | 12,612,285 |
| 2009 | 13.81 | 2,229 | 12,666,858 |
| 2010 | 13.62 | 2,232 | 12,702,379 |
| 2011 | 13.86 | 2,310 | 12,742,886 |
| 2012 | 12.30 | 2,067 | 12,763,536 |
| 2013 | 13.22 | 2,234 | 12,773,801 |
| 2014 | 13.08 | 2,259 | 12,787,209 |
| 2015 | 13.51 | 2,343 | 12,802,503 |
| 2016 | 13.52 | 2,352 | 12,784,227 |
| 2017 | 13.62 | 2,412 | 12,805,537 |
| 2018 | 13.24 | 2,395 | 12,807,060 |
| 2019 | 12.58 | 2,285 | 12,801,989 |
| 2020 | 12.61 | 2,277 | 12,783,254 |
| 2021 | 13.86 | 2,491 | 12,964,056 |

| Date | Rate | Total | Population |
| 1999 | 10.28 | 1,284 | 12,263,805 |
| 2000 | 10.79 | 1,356 | 12,281,054 |
| 2001 | 10.15 | 1,276 | 12,298,970 |
| 2002 | 10.68 | 1,341 | 12,331,031 |
| 2003 | 10.55 | 1,340 | 12,374,658 |
| 2004 | 11.08 | 1,410 | 12,410,722 |
| 2005 | 11.11 | 1,430 | 12,449,990 |
| 2006 | 10.82 | 1,396 | 12,510,809 |
| 2007 | 11.06 | 1,441 | 12,563,937 |
| 2008 | 11.78 | 1,539 | 12,612,285 |
| 2009 | 12.22 | 1,631 | 12,666,858 |
| 2010 | 11.88 | 1,576 | 12,702,379 |
| 2011 | 13.18 | 1,747 | 12,742,886 |
| 2012 | 12.39 | 1,647 | 12,763,536 |
| 2013 | 13.36 | 1,788 | 12,773,801 |
| 2014 | 13.30 | 1,817 | 12,787,209 |
| 2015 | 13.99 | 1,894 | 12,802,503 |
| 2016 | 14.68 | 1,970 | 12,784,227 |
| 2017 | 15.02 | 2,030 | 12,805,537 |
| 2018 | 14.87 | 2,014 | 12,807,060 |
| 2019 | 14.06 | 1,896 | 12,801,989 |
| 2020 | 12.58 | 1,694 | 12,783,254 |
| 2021 | 13.94 | 1,885 | 12,964,056 |

| Date | Rate | Total | Population |
| 1999 | 5.05 | 750 | 12,263,805 |
| 2000 | 5.60 | 838 | 12,281,054 |
| 2001 | 5.59 | 844 | 12,298,970 |
| 2002 | 5.55 | 849 | 12,331,031 |
| 2003 | 6.15 | 953 | 12,374,658 |
| 2004 | 6.13 | 960 | 12,410,722 |
| 2005 | 6.67 | 1,058 | 12,449,990 |
| 2006 | 6.00 | 971 | 12,510,809 |
| 2007 | 6.06 | 996 | 12,563,937 |
| 2008 | 6.16 | 1,024 | 12,612,285 |
| 2009 | 6.25 | 1,046 | 12,666,858 |
| 2010 | 5.73 | 977 | 12,702,379 |
| 2011 | 6.57 | 1,150 | 12,742,886 |
| 2012 | 5.91 | 1,046 | 12,763,536 |
| 2013 | 6.52 | 1,165 | 12,773,801 |
| 2014 | 5.90 | 1,064 | 12,787,209 |
| 2015 | 6.08 | 1,108 | 12,802,503 |
| 2016 | 6.04 | 1,115 | 12,784,227 |
| 2017 | 5.52 | 1,025 | 12,805,537 |
| 2018 | 5.91 | 1,116 | 12,807,060 |
| 2019 | 6.00 | 1,128 | 12,801,989 |
| 2020 | 7.42 | 1,419 | 12,783,254 |
| 2021 | 7.46 | 1,353 | 12,964,056 |

| Date | Rate | Total | Population |
| 1999 | 7.47 | 1,024 | 12,263,805 |
| 2000 | 7.88 | 1,089 | 12,281,054 |
| 2001 | 8.16 | 1,134 | 12,298,970 |
| 2002 | 8.24 | 1,156 | 12,331,031 |
| 2003 | 8.24 | 1,169 | 12,374,658 |
| 2004 | 7.70 | 1,101 | 12,410,722 |
| 2005 | 7.30 | 1,058 | 12,449,990 |
| 2006 | 7.21 | 1,057 | 12,510,809 |
| 2007 | 7.30 | 1,084 | 12,563,937 |
| 2008 | 7.45 | 1,113 | 12,612,285 |
| 2009 | 7.60 | 1,163 | 12,666,858 |
| 2010 | 7.83 | 1,200 | 12,702,379 |
| 2011 | 7.82 | 1,216 | 12,742,886 |
| 2012 | 7.92 | 1,240 | 12,763,536 |
| 2013 | 7.97 | 1,265 | 12,773,801 |
| 2014 | 8.14 | 1,301 | 12,787,209 |
| 2015 | 8.85 | 1,438 | 12,802,503 |
| 2016 | 8.67 | 1,414 | 12,784,227 |
| 2017 | 8.04 | 1,336 | 12,805,537 |
| 2018 | 8.18 | 1,366 | 12,807,060 |
| 2019 | 8.74 | 1,479 | 12,801,989 |
| 2020 | 9.87 | 1,632 | 12,783,254 |
| 2021 | 10.98 | 1,825 | 12,964,056 |

| Date | Rate | Total | Population |
| 1999 | 4.94 | 754 | 12,263,805 |
| 2000 | 6.05 | 933 | 12,281,054 |
| 2001 | 6.56 | 1,022 | 12,298,970 |
| 2002 | 6.57 | 1,031 | 12,331,031 |
| 2003 | 6.33 | 1,005 | 12,374,658 |
| 2004 | 6.40 | 1,019 | 12,410,722 |
| 2005 | 6.61 | 1,065 | 12,449,990 |
| 2006 | 7.25 | 1,184 | 12,510,809 |
| 2007 | 7.06 | 1,162 | 12,563,937 |
| 2008 | 7.25 | 1,204 | 12,612,285 |
| 2009 | 6.78 | 1,132 | 12,666,858 |
| 2010 | 7.09 | 1,184 | 12,702,379 |
| 2011 | 7.56 | 1,295 | 12,742,886 |
| 2012 | 7.31 | 1,265 | 12,763,536 |
| 2013 | 7.51 | 1,298 | 12,773,801 |
| 2014 | 7.88 | 1,396 | 12,787,209 |
| 2015 | 7.64 | 1,348 | 12,802,503 |
| 2016 | 8.03 | 1,417 | 12,784,227 |
| 2017 | 8.58 | 1,557 | 12,805,537 |
| 2018 | 8.76 | 1,614 | 12,807,060 |
| 2019 | 8.67 | 1,610 | 12,801,989 |
| 2020 | 9.65 | 1,799 | 12,783,254 |
| 2021 | 9.46 | 1,688 | 12,964,056 |

| Date | Rate | Total | Population |
| 1999 | 5.40 | 639 | 12,263,805 |
| 2000 | 5.47 | 650 | 12,281,054 |
| 2001 | 5.66 | 671 | 12,298,970 |
| 2002 | 5.39 | 640 | 12,331,031 |
| 2003 | 5.69 | 676 | 12,374,658 |
| 2004 | 5.76 | 683 | 12,410,722 |
| 2005 | 6.27 | 749 | 12,449,990 |
| 2006 | 6.40 | 769 | 12,510,809 |
| 2007 | 6.25 | 750 | 12,563,937 |
| 2008 | 5.79 | 697 | 12,612,285 |
| 2009 | 5.37 | 650 | 12,666,858 |
| 2010 | 5.64 | 689 | 12,702,379 |
| 2011 | 5.60 | 681 | 12,742,886 |
| 2012 | 5.83 | 698 | 12,763,536 |
| 2013 | 5.30 | 634 | 12,773,801 |
| 2014 | 5.16 | 620 | 12,787,209 |
| 2015 | 5.55 | 673 | 12,802,503 |
| 2016 | 5.98 | 723 | 12,784,227 |
| 2017 | 6.65 | 791 | 12,805,537 |
| 2018 | 6.42 | 781 | 12,807,060 |
| 2019 | 6.09 | 722 | 12,801,989 |
| 2020 | 8.48 | 994 | 12,783,254 |
| 2021 | 9.17 | 1,101 | 12,964,056 |
CHOOSE NEW STATE
COVID-19 UPDATE
4/1/24
| CASES | DEATHS |
|
3,565,499
|
51,480
|
COVID-19 DEATH SIMULATOR
Current Covid-19 deaths compared to a simulated calendar based historical average of selected Pennsylvania causes.

WITH STATE ADJUSTMENTS

WITH STATE ADJUSTMENTS

WITH STATE ADJUSTMENTS
Centers for Disease Control and Prevention: Final Deaths 2021 Release Date 12/22.


