HEALTH RANKINGS Delaware

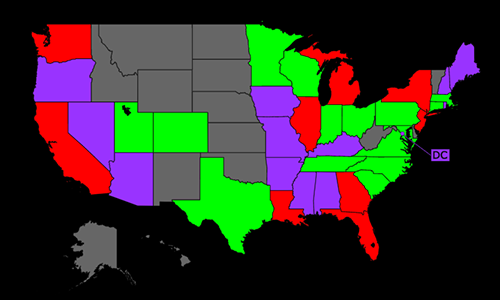
AGE-STANDARDIZED DEATH RATE: CDC 12/22
PER 100,000 POPULATION
GOOD
POOR
| CAUSES OF DEATH | Rate | USA Rank | |
| 1. | Coronary Heart Disease |
91.21
|
27
|
| 2. | COVID-19 |
83.18
|
31
|
| 3. | Stroke |
56.85
|
2
|
| 4. | Poisonings |
52.72
|
7
|
| 5. | Lung Disease |
34.64
|
29
|
| 6. | Lung Cancers |
32.96
|
25
|
| 7. | Alzheimers |
29.74
|
29
|
| 8. | Diabetes Mellitus |
23.94
|
34
|
| 9. | Prostate Cancer |
23.68
|
5
|
| 10. | Hypertension |
22.69
|
42
|
| 11. | Breast Cancer |
22.35
|
3
|
| 12. | Endocrine Disorders |
15.29
|
29
|
| 13. | Suicide |
13.64
|
40
|
| 14. | Kidney Disease |
12.69
|
30
|
| 15. | Pancreas Cancer |
12.06
|
14
|
| 16. | Homicide |
11.33
|
13
|
| 17. | Liver Disease |
10.86
|
46
|
| 18. | Colon-Rectum Cancers |
10.79
|
47
|
| 19. | Parkinson's Disease |
9.73
|
32
|
| 20. | Lymphomas |
9.61
|
8
|
| CAUSES OF DEATH | Rate | USA Rank | |
| 21. | Influenza & Pneumonia |
8.70
|
37
|
| 22. | Inflammatory/Heart |
7.99
|
17
|
| 23. | Ovary Cancer |
7.72
|
2
|
| 24. | Falls |
7.09
|
48
|
| 25. | Alcohol |
6.87
|
11
|
| 26. | Liver Cancer |
6.80
|
21
|
| 27. | Leukemia |
6.17
|
20
|
| 28. | Bladder Cancer |
6.15
|
1
|
| 29. | Uterin Cancer |
5.84
|
10
|
| 30. | Other Neoplasms |
4.26
|
25
|
| 31. | Oesophagus Cancer |
3.45
|
35
|
| 32. | Skin Cancers |
3.40
|
21
|
| 33. | Congenital Anomalies |
3.26
|
26
|
| 34. | Oral Cancer |
3.10
|
14
|
| 35. | Stomach Cancer |
2.85
|
13
|
| 36. | HIV/AIDS |
1.75
|
9
|
| 37. | Cervical Cancer |
0.00
|
0
|
| 38. | Drownings |
0.00
|
0
|
| 39. | Drug Use |
0.00
|
0
|
| 40. | Hepatitis C |
0.00
|
0
|

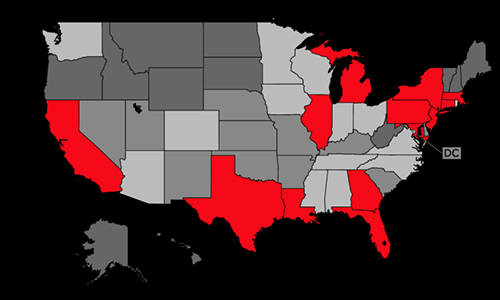
PERCENT TOP 50 CAUSES: CDC 12/22
| CAUSES OF DEATH | Deaths | % | |
| 1. | Coronary Heart Disease |
1,231
|
14.95
|
| 2. | COVID-19 |
1,102
|
13.39
|
| 3. | Stroke |
748
|
9.09
|
| 4. | Poisonings |
499
|
6.06
|
| 5. | Lung Cancers |
486
|
5.90
|
| 6. | Lung Disease |
484
|
5.88
|
| 7. | Alzheimers |
375
|
4.56
|
| 8. | Diabetes Mellitus |
323
|
3.92
|
| 9. | Hypertension |
303
|
3.68
|
| 10. | Endocrine Disorders |
190
|
2.31
|
| 11. | Pancreas Cancer |
175
|
2.13
|
| 12. | Kidney Disease |
168
|
2.04
|
| 13. | Breast Cancer |
151
|
1.83
|
| 14. | Colon-Rectum Cancers |
144
|
1.75
|
| 15. | Prostate Cancer |
140
|
1.70
|
| 16. | Liver Disease |
138
|
1.68
|
| 17. | Road Traffic Accidents |
132
|
1.60
|
| 18. | Lymphomas |
132
|
1.60
|
| 19. | Parkinson's Disease |
130
|
1.58
|
| 20. | Suicide |
130
|
1.58
|
| 21. | Influenza & Pneumonia |
112
|
1.36
|
| 22. | Liver Cancer |
94
|
1.14
|
| 23. | Inflammatory/Heart |
93
|
1.13
|
| 24. | Bladder Cancer |
82
|
1.00
|
| 25. | Falls |
79
|
0.96
|
| CAUSES OF DEATH | Deaths | % | |
| 26. | Homicide |
77
|
0.94
|
| 27. | Alcohol |
72
|
0.87
|
| 28. | Other Injuries |
68
|
0.83
|
| 29. | Leukemia |
63
|
0.77
|
| 30. | Skin Cancers |
49
|
0.60
|
| 31. | Ovary Cancer |
48
|
0.58
|
| 32. | Malnutrition |
43
|
0.52
|
| 33. | Other Neoplasms |
39
|
0.47
|
| 34. | Uterin Cancer |
36
|
0.44
|
| 35. | Oesophagus Cancer |
28
|
0.34
|
| 36. | Oral Cancer |
25
|
0.30
|
| 37. | Stomach Cancer |
13
|
0.16
|
| 38. | Diarrhoeal diseases |
10
|
0.12
|
| 39. | Multiple Sclerosis |
10
|
0.12
|
| 40. | HIV/AIDS |
10
|
0.12
|
| 41. | Tuberculosis |
0
|
0.00
|
| 42. | Upper Respiratory |
0
|
0.00
|
| 43. | Otitis Media |
0
|
0.00
|
| 44. | Maternal Conditions |
0
|
0.00
|
| 45. | Hookworm Disease |
0
|
0.00
|
| 46. | Trichuriasis |
0
|
0.00
|
| 47. | Ascariasis |
0
|
0.00
|
| 48. | Encephalitis |
0
|
0.00
|
| 49. | Dengue |
0
|
0.00
|
| 50. | Leprosy |
0
|
0.00
|

AGE-STANDARDIZED DEATH RATE: CDC 12/22
PER 100,000 POPULATION
GOOD
POOR
| Rate | USA Rank | ||
| 1. | Lung Cancers |
32.96
|
25
|
| 2. | Prostate Cancer |
23.68
|
5
|
| 3. | Breast Cancer |
22.35
|
3
|
| 4. | Pancreas Cancer |
12.06
|
14
|
| 5. | Colon-Rectum Cancers |
10.79
|
47
|
| 6. | Lymphomas |
9.61
|
8
|
| 7. | Ovary Cancer |
7.72
|
2
|
| 8. | Liver Cancer |
6.80
|
21
|
| Rate | USA Rank | ||
| 9. | Leukemia |
6.17
|
20
|
| 10. | Bladder Cancer |
6.15
|
1
|
| 11. | Uterin Cancer |
5.84
|
10
|
| 12. | Oesophagus Cancer |
3.45
|
35
|
| 13. | Skin Cancers |
3.40
|
21
|
| 14. | Oral Cancer |
3.10
|
14
|
| 15. | Stomach Cancer |
2.85
|
13
|
| 16. | Cervical Cancer |
0.00
|
0
|
DEATH RATE HISTORY SELECTED CAUSES

| Date | Rate | Total | Population |
| 1999 | 269.22 | 2,011 | 774,990 |
| 2000 | 262.50 | 1,983 | 783,600 |
| 2001 | 261.21 | 2,033 | 795,699 |
| 2002 | 239.85 | 1,918 | 806,169 |
| 2003 | 247.15 | 2,027 | 818,003 |
| 2004 | 238.07 | 2,015 | 830,803 |
| 2005 | 232.32 | 2,031 | 845,150 |
| 2006 | 205.98 | 1,866 | 859,268 |
| 2007 | 205.11 | 1,914 | 871,749 |
| 2008 | 184.25 | 1,777 | 883,874 |
| 2009 | 182.32 | 1,796 | 891,730 |
| 2010 | 175.66 | 1,776 | 897,934 |
| 2011 | 175.21 | 1,809 | 907,135 |
| 2012 | 168.79 | 1,790 | 917,092 |
| 2013 | 168.01 | 1,861 | 925,749 |
| 2014 | 168.66 | 1,921 | 935,614 |
| 2015 | 165.24 | 1,940 | 945,934 |
| 2016 | 163.16 | 1,974 | 952,065 |
| 2017 | 158.36 | 1,990 | 961,939 |
| 2018 | 159.14 | 2,030 | 967,171 |
| 2019 | 154.30 | 2,053 | 973,764 |
| 2020 | 159.56 | 2,171 | 986,809 |
| 2021 | 162.73 | 2,183 | 1,003,384 |

| Date | Rate | Total | Population |
| 1999 | 223.29 | 1,737 | 774,990 |
| 2000 | 203.26 | 1,609 | 783,600 |
| 2001 | 220.98 | 1,786 | 795,699 |
| 2002 | 194.75 | 1,621 | 806,169 |
| 2003 | 201.54 | 1,719 | 818,003 |
| 2004 | 208.28 | 1,827 | 830,803 |
| 2005 | 199.10 | 1,799 | 845,150 |
| 2006 | 190.70 | 1,780 | 859,268 |
| 2007 | 193.52 | 1,853 | 871,749 |
| 2008 | 193.26 | 1,912 | 883,874 |
| 2009 | 178.65 | 1,813 | 891,730 |
| 2010 | 185.67 | 1,909 | 897,934 |
| 2011 | 179.83 | 1,906 | 907,135 |
| 2012 | 177.02 | 1,935 | 917,092 |
| 2013 | 167.63 | 1,905 | 925,749 |
| 2014 | 167.29 | 1,972 | 935,614 |
| 2015 | 165.56 | 2,010 | 945,934 |
| 2016 | 170.83 | 2,124 | 952,065 |
| 2017 | 160.44 | 2,085 | 961,939 |
| 2018 | 159.43 | 2,101 | 967,171 |
| 2019 | 151.88 | 2,074 | 973,764 |
| 2020 | 151.09 | 2,141 | 986,809 |
| 2021 | 153.18 | 2,178 | 1,003,384 |

| Date | Rate | Total | Population |
| 1999 | 49.37 | 365 | 774,990 |
| 2000 | 57.60 | 430 | 783,600 |
| 2001 | 50.09 | 383 | 795,699 |
| 2002 | 51.43 | 405 | 806,169 |
| 2003 | 49.91 | 407 | 818,003 |
| 2004 | 41.80 | 350 | 830,803 |
| 2005 | 44.27 | 384 | 845,150 |
| 2006 | 42.92 | 384 | 859,268 |
| 2007 | 40.38 | 374 | 871,749 |
| 2008 | 37.86 | 365 | 883,874 |
| 2009 | 42.51 | 415 | 891,730 |
| 2010 | 40.69 | 407 | 897,934 |
| 2011 | 40.54 | 418 | 907,135 |
| 2012 | 38.20 | 404 | 917,092 |
| 2013 | 36.96 | 409 | 925,749 |
| 2014 | 38.79 | 439 | 935,614 |
| 2015 | 39.38 | 466 | 945,934 |
| 2016 | 41.63 | 506 | 952,065 |
| 2017 | 46.17 | 571 | 961,939 |
| 2018 | 46.41 | 605 | 967,171 |
| 2019 | 45.09 | 594 | 973,764 |
| 2020 | 52.54 | 716 | 986,809 |
| 2021 | 56.85 | 756 | 1,003,384 |

| Date | Rate | Total | Population |
| 1999 | 42.74 | 327 | 774,990 |
| 2000 | 44.00 | 341 | 783,600 |
| 2001 | 38.32 | 306 | 795,699 |
| 2002 | 43.26 | 350 | 806,169 |
| 2003 | 40.55 | 339 | 818,003 |
| 2004 | 40.40 | 345 | 830,803 |
| 2005 | 46.80 | 411 | 845,150 |
| 2006 | 37.87 | 344 | 859,268 |
| 2007 | 40.51 | 379 | 871,749 |
| 2008 | 48.88 | 472 | 883,874 |
| 2009 | 43.37 | 428 | 891,730 |
| 2010 | 43.98 | 441 | 897,934 |
| 2011 | 44.77 | 460 | 907,135 |
| 2012 | 39.05 | 420 | 917,092 |
| 2013 | 43.47 | 482 | 925,749 |
| 2014 | 40.20 | 458 | 935,614 |
| 2015 | 42.45 | 510 | 945,934 |
| 2016 | 43.71 | 544 | 952,065 |
| 2017 | 40.75 | 526 | 961,939 |
| 2018 | 40.44 | 532 | 967,171 |
| 2019 | 35.22 | 474 | 973,764 |
| 2020 | 32.68 | 468 | 986,809 |
| 2021 | 36.07 | 502 | 1,003,384 |

| Date | Rate | Total | Population |
| 1999 | 35.25 | 267 | 774,990 |
| 2000 | 37.54 | 290 | 783,600 |
| 2001 | 36.61 | 290 | 795,699 |
| 2002 | 36.40 | 292 | 806,169 |
| 2003 | 34.85 | 287 | 818,003 |
| 2004 | 35.40 | 294 | 830,803 |
| 2005 | 34.45 | 293 | 845,150 |
| 2006 | 37.96 | 329 | 859,268 |
| 2007 | 34.83 | 309 | 871,749 |
| 2008 | 39.58 | 352 | 883,874 |
| 2009 | 36.75 | 333 | 891,730 |
| 2010 | 39.18 | 357 | 897,934 |
| 2011 | 36.44 | 338 | 907,135 |
| 2012 | 38.83 | 374 | 917,092 |
| 2013 | 42.92 | 412 | 925,749 |
| 2014 | 43.74 | 425 | 935,614 |
| 2015 | 46.00 | 449 | 945,934 |
| 2016 | 52.37 | 516 | 952,065 |
| 2017 | 61.86 | 608 | 961,939 |
| 2018 | 67.10 | 662 | 967,171 |
| 2019 | 73.95 | 728 | 973,764 |
| 2020 | 70.85 | 722 | 986,809 |
| 2021 | 80.56 | 817 | 1,003,384 |

| Date | Rate | Total | Population |
| 1999 | 23.53 | 179 | 774,990 |
| 2000 | 24.59 | 193 | 783,600 |
| 2001 | 27.45 | 218 | 795,699 |
| 2002 | 26.12 | 215 | 806,169 |
| 2003 | 28.35 | 239 | 818,003 |
| 2004 | 24.50 | 210 | 830,803 |
| 2005 | 26.45 | 233 | 845,150 |
| 2006 | 20.56 | 191 | 859,268 |
| 2007 | 23.59 | 223 | 871,749 |
| 2008 | 22.50 | 217 | 883,874 |
| 2009 | 20.81 | 206 | 891,730 |
| 2010 | 19.17 | 196 | 897,934 |
| 2011 | 21.47 | 224 | 907,135 |
| 2012 | 22.33 | 241 | 917,092 |
| 2013 | 19.38 | 218 | 925,749 |
| 2014 | 19.80 | 226 | 935,614 |
| 2015 | 18.11 | 215 | 945,934 |
| 2016 | 17.03 | 203 | 952,065 |
| 2017 | 19.07 | 244 | 961,939 |
| 2018 | 18.82 | 238 | 967,171 |
| 2019 | 20.52 | 267 | 973,764 |
| 2020 | 23.79 | 326 | 986,809 |
| 2021 | 23.94 | 334 | 1,003,384 |

| Date | Rate | Total | Population |
| 1999 | 15.04 | 107 | 774,990 |
| 2000 | 15.11 | 110 | 783,600 |
| 2001 | 17.95 | 135 | 795,699 |
| 2002 | 16.69 | 128 | 806,169 |
| 2003 | 18.60 | 147 | 818,003 |
| 2004 | 18.97 | 155 | 830,803 |
| 2005 | 21.23 | 180 | 845,150 |
| 2006 | 21.62 | 189 | 859,268 |
| 2007 | 22.14 | 201 | 871,749 |
| 2008 | 21.70 | 204 | 883,874 |
| 2009 | 16.94 | 163 | 891,730 |
| 2010 | 21.88 | 215 | 897,934 |
| 2011 | 20.02 | 203 | 907,135 |
| 2012 | 20.18 | 213 | 917,092 |
| 2013 | 17.59 | 192 | 925,749 |
| 2014 | 16.62 | 188 | 935,614 |
| 2015 | 22.62 | 264 | 945,934 |
| 2016 | 27.38 | 329 | 952,065 |
| 2017 | 30.55 | 377 | 961,939 |
| 2018 | 32.66 | 412 | 967,171 |
| 2019 | 25.87 | 339 | 973,764 |
| 2020 | 35.08 | 474 | 986,809 |
| 2021 | 29.74 | 381 | 1,003,384 |

| Date | Rate | Total | Population |
| 1999 | 21.31 | 155 | 774,990 |
| 2000 | 30.96 | 229 | 783,600 |
| 2001 | 23.83 | 181 | 795,699 |
| 2002 | 21.40 | 168 | 806,169 |
| 2003 | 15.84 | 127 | 818,003 |
| 2004 | 17.39 | 145 | 830,803 |
| 2005 | 18.83 | 162 | 845,150 |
| 2006 | 15.59 | 138 | 859,268 |
| 2007 | 12.71 | 117 | 871,749 |
| 2008 | 14.41 | 135 | 883,874 |
| 2009 | 13.50 | 132 | 891,730 |
| 2010 | 13.84 | 138 | 897,934 |
| 2011 | 12.97 | 133 | 907,135 |
| 2012 | 11.26 | 121 | 917,092 |
| 2013 | 13.56 | 150 | 925,749 |
| 2014 | 13.82 | 156 | 935,614 |
| 2015 | 16.07 | 189 | 945,934 |
| 2016 | 10.73 | 132 | 952,065 |
| 2017 | 14.87 | 184 | 961,939 |
| 2018 | 13.08 | 167 | 967,171 |
| 2019 | 10.48 | 132 | 973,764 |
| 2020 | 11.61 | 156 | 986,809 |
| 2021 | 8.58 | 118 | 1,003,384 |

| Date | Rate | Total | Population |
| 1999 | 13.39 | 100 | 774,990 |
| 2000 | 14.39 | 111 | 783,600 |
| 2001 | 13.89 | 108 | 795,699 |
| 2002 | 14.52 | 117 | 806,169 |
| 2003 | 15.64 | 130 | 818,003 |
| 2004 | 15.14 | 128 | 830,803 |
| 2005 | 14.69 | 128 | 845,150 |
| 2006 | 16.86 | 152 | 859,268 |
| 2007 | 17.43 | 163 | 871,749 |
| 2008 | 19.75 | 189 | 883,874 |
| 2009 | 17.74 | 176 | 891,730 |
| 2010 | 15.42 | 158 | 897,934 |
| 2011 | 14.17 | 149 | 907,135 |
| 2012 | 12.74 | 139 | 917,092 |
| 2013 | 16.02 | 178 | 925,749 |
| 2014 | 14.84 | 173 | 935,614 |
| 2015 | 14.55 | 174 | 945,934 |
| 2016 | 17.08 | 208 | 952,065 |
| 2017 | 16.06 | 205 | 961,939 |
| 2018 | 16.29 | 209 | 967,171 |
| 2019 | 15.68 | 210 | 973,764 |
| 2020 | 12.45 | 175 | 986,809 |
| 2021 | 12.09 | 165 | 1,003,384 |

| Date | Rate | Total | Population |
| 1999 | 13.88 | 103 | 774,990 |
| 2000 | 18.62 | 142 | 783,600 |
| 2001 | 16.20 | 128 | 795,699 |
| 2002 | 16.47 | 133 | 806,169 |
| 2003 | 15.66 | 130 | 818,003 |
| 2004 | 14.22 | 121 | 830,803 |
| 2005 | 14.58 | 128 | 845,150 |
| 2006 | 12.82 | 117 | 859,268 |
| 2007 | 12.09 | 113 | 871,749 |
| 2008 | 14.13 | 139 | 883,874 |
| 2009 | 11.91 | 118 | 891,730 |
| 2010 | 10.96 | 111 | 897,934 |
| 2011 | 10.78 | 114 | 907,135 |
| 2012 | 11.00 | 121 | 917,092 |
| 2013 | 14.27 | 157 | 925,749 |
| 2014 | 11.95 | 136 | 935,614 |
| 2015 | 12.23 | 145 | 945,934 |
| 2016 | 12.15 | 144 | 952,065 |
| 2017 | 10.09 | 132 | 961,939 |
| 2018 | 9.05 | 116 | 967,171 |
| 2019 | 8.06 | 107 | 973,764 |
| 2020 | 7.27 | 100 | 986,809 |
| 2021 | 9.35 | 122 | 1,003,384 |

| Date | Rate | Total | Population |
| 1999 | 11.04 | 86 | 774,990 |
| 2000 | 10.41 | 82 | 783,600 |
| 2001 | 13.46 | 108 | 795,699 |
| 2002 | 9.11 | 74 | 806,169 |
| 2003 | 11.35 | 94 | 818,003 |
| 2004 | 11.03 | 93 | 830,803 |
| 2005 | 9.66 | 83 | 845,150 |
| 2006 | 10.31 | 91 | 859,268 |
| 2007 | 10.60 | 95 | 871,749 |
| 2008 | 11.92 | 109 | 883,874 |
| 2009 | 11.71 | 107 | 891,730 |
| 2010 | 11.34 | 106 | 897,934 |
| 2011 | 11.00 | 105 | 907,135 |
| 2012 | 13.20 | 125 | 917,092 |
| 2013 | 12.49 | 122 | 925,749 |
| 2014 | 13.16 | 126 | 935,614 |
| 2015 | 12.59 | 122 | 945,934 |
| 2016 | 11.48 | 119 | 952,065 |
| 2017 | 11.63 | 112 | 961,939 |
| 2018 | 11.36 | 113 | 967,171 |
| 2019 | 11.27 | 111 | 973,764 |
| 2020 | 12.28 | 124 | 986,809 |
| 2021 | 13.64 | 137 | 1,003,384 |

| Date | Rate | Total | Population |
| 1999 | 3.89 | 29 | 774,990 |
| 2000 | 6.27 | 46 | 783,600 |
| 2001 | 6.07 | 46 | 795,699 |
| 2002 | 6.85 | 55 | 806,169 |
| 2003 | 6.74 | 54 | 818,003 |
| 2004 | 8.96 | 75 | 830,803 |
| 2005 | 8.26 | 71 | 845,150 |
| 2006 | 4.76 | 43 | 859,268 |
| 2007 | 5.00 | 46 | 871,749 |
| 2008 | 5.22 | 51 | 883,874 |
| 2009 | 5.85 | 56 | 891,730 |
| 2010 | 6.23 | 62 | 897,934 |
| 2011 | 5.12 | 52 | 907,135 |
| 2012 | 4.01 | 43 | 917,092 |
| 2013 | 6.24 | 69 | 925,749 |
| 2014 | 4.26 | 48 | 935,614 |
| 2015 | 5.42 | 64 | 945,934 |
| 2016 | 5.03 | 59 | 952,065 |
| 2017 | 4.06 | 51 | 961,939 |
| 2018 | 5.19 | 65 | 967,171 |
| 2019 | 6.95 | 93 | 973,764 |
| 2020 | 7.88 | 108 | 986,809 |
| 2021 | 9.14 | 123 | 1,003,384 |

| Date | Rate | Total | Population |
| 1999 | 8.66 | 68 | 774,990 |
| 2000 | 8.91 | 71 | 783,600 |
| 2001 | 9.20 | 75 | 795,699 |
| 2002 | 10.48 | 88 | 806,169 |
| 2003 | 11.90 | 102 | 818,003 |
| 2004 | 8.78 | 78 | 830,803 |
| 2005 | 7.27 | 67 | 845,150 |
| 2006 | 7.97 | 74 | 859,268 |
| 2007 | 7.38 | 70 | 871,749 |
| 2008 | 9.12 | 91 | 883,874 |
| 2009 | 9.04 | 94 | 891,730 |
| 2010 | 8.75 | 93 | 897,934 |
| 2011 | 8.56 | 92 | 907,135 |
| 2012 | 7.04 | 76 | 917,092 |
| 2013 | 7.18 | 82 | 925,749 |
| 2014 | 9.27 | 110 | 935,614 |
| 2015 | 9.56 | 111 | 945,934 |
| 2016 | 7.50 | 92 | 952,065 |
| 2017 | 8.95 | 106 | 961,939 |
| 2018 | 8.41 | 109 | 967,171 |
| 2019 | 9.26 | 118 | 973,764 |
| 2020 | 10.84 | 143 | 986,809 |
| 2021 | 10.86 | 146 | 1,003,384 |

| Date | Rate | Total | Population |
| 1999 | 5.33 | 40 | 774,990 |
| 2000 | 6.37 | 48 | 783,600 |
| 2001 | 6.13 | 47 | 795,699 |
| 2002 | 5.03 | 40 | 806,169 |
| 2003 | 4.96 | 40 | 818,003 |
| 2004 | 5.52 | 46 | 830,803 |
| 2005 | 7.76 | 67 | 845,150 |
| 2006 | 5.15 | 46 | 859,268 |
| 2007 | 6.02 | 55 | 871,749 |
| 2008 | 5.32 | 50 | 883,874 |
| 2009 | 5.56 | 53 | 891,730 |
| 2010 | 5.78 | 57 | 897,934 |
| 2011 | 7.79 | 79 | 907,135 |
| 2012 | 6.85 | 71 | 917,092 |
| 2013 | 7.40 | 81 | 925,749 |
| 2014 | 7.41 | 82 | 935,614 |
| 2015 | 7.27 | 84 | 945,934 |
| 2016 | 6.05 | 72 | 952,065 |
| 2017 | 8.49 | 107 | 961,939 |
| 2018 | 9.05 | 116 | 967,171 |
| 2019 | 6.95 | 94 | 973,764 |
| 2020 | 9.19 | 126 | 986,809 |
| 2021 | 9.73 | 131 | 1,003,384 |

| Date | Rate | Total | Population |
| 1999 | 3.04 | 24 | 774,990 |
| 2000 | 2.92 | 23 | 783,600 |
| 2001 | 4.14 | 33 | 795,699 |
| 2002 | 4.68 | 38 | 806,169 |
| 2003 | 3.07 | 25 | 818,003 |
| 2004 | 4.24 | 35 | 830,803 |
| 2005 | 6.58 | 55 | 845,150 |
| 2006 | 6.08 | 50 | 859,268 |
| 2007 | 5.70 | 48 | 871,749 |
| 2008 | 7.62 | 65 | 883,874 |
| 2009 | 5.17 | 45 | 891,730 |
| 2010 | 7.03 | 61 | 897,934 |
| 2011 | 5.37 | 49 | 907,135 |
| 2012 | 6.86 | 62 | 917,092 |
| 2013 | 5.81 | 52 | 925,749 |
| 2014 | 6.57 | 57 | 935,614 |
| 2015 | 7.48 | 65 | 945,934 |
| 2016 | 7.03 | 63 | 952,065 |
| 2017 | 6.93 | 63 | 961,939 |
| 2018 | 6.83 | 57 | 967,171 |
| 2019 | 6.14 | 53 | 973,764 |
| 2020 | 9.88 | 86 | 986,809 |
| 2021 | 11.33 | 103 | 1,003,384 |
CHOOSE NEW STATE
COVID-19 UPDATE
4/1/24
| CASES | DEATHS |
|
350,399
|
3,638
|
COVID-19 DEATH SIMULATOR
Current Covid-19 deaths compared to a simulated calendar based historical average of selected Delaware causes.

WITH STATE ADJUSTMENTS

WITH STATE ADJUSTMENTS

WITH STATE ADJUSTMENTS
Centers for Disease Control and Prevention: Final Deaths 2021 Release Date 12/22.


