HEALTH RANKINGS Connecticut

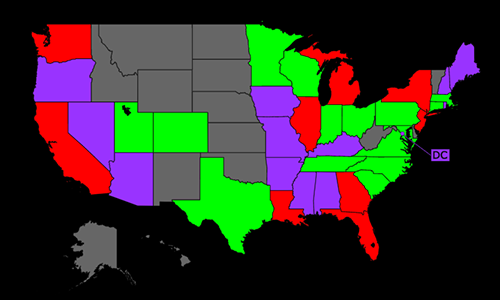
AGE-STANDARDIZED DEATH RATE: CDC 12/22
PER 100,000 POPULATION
GOOD
POOR
| CAUSES OF DEATH | Rate | USA Rank | |
| 1. | Coronary Heart Disease |
66.45
|
48
|
| 2. | COVID-19 |
56.65
|
48
|
| 3. | Poisonings |
41.76
|
11
|
| 4. | Stroke |
29.52
|
47
|
| 5. | Lung Cancers |
27.23
|
42
|
| 6. | Lung Disease |
22.69
|
47
|
| 7. | Alzheimers |
21.24
|
45
|
| 8. | Hypertension |
19.27
|
47
|
| 9. | Prostate Cancer |
18.86
|
37
|
| 10. | Diabetes Mellitus |
15.95
|
51
|
| 11. | Breast Cancer |
15.63
|
48
|
| 12. | Endocrine Disorders |
14.07
|
39
|
| 13. | Kidney Disease |
13.41
|
25
|
| 14. | Pancreas Cancer |
12.54
|
7
|
| 15. | Liver Disease |
12.24
|
39
|
| 16. | Falls |
10.70
|
35
|
| 17. | Colon-Rectum Cancers |
10.39
|
49
|
| 18. | Suicide |
9.98
|
46
|
| 19. | Parkinson's Disease |
9.02
|
44
|
| 20. | Influenza & Pneumonia |
8.28
|
39
|
| CAUSES OF DEATH | Rate | USA Rank | |
| 21. | Lymphomas |
7.86
|
45
|
| 22. | Leukemia |
5.69
|
37
|
| 23. | Inflammatory/Heart |
5.57
|
47
|
| 24. | Liver Cancer |
5.38
|
42
|
| 25. | Uterin Cancer |
5.20
|
26
|
| 26. | Ovary Cancer |
4.95
|
48
|
| 27. | Other Neoplasms |
4.93
|
8
|
| 28. | Homicide |
4.79
|
35
|
| 29. | Alcohol |
4.27
|
35
|
| 30. | Bladder Cancer |
3.95
|
41
|
| 31. | Oesophagus Cancer |
3.28
|
41
|
| 32. | Skin Cancers |
2.68
|
42
|
| 33. | Stomach Cancer |
2.39
|
30
|
| 34. | Congenital Anomalies |
2.22
|
44
|
| 35. | Oral Cancer |
2.01
|
47
|
| 36. | Cervical Cancer |
1.98
|
25
|
| 37. | Low Birth Weight |
1.40
|
24
|
| 38. | Drug Use |
1.22
|
17
|
| 39. | HIV/AIDS |
0.79
|
25
|
| 40. | Drownings |
0.75
|
41
|

PERCENT TOP 50 CAUSES: CDC 12/22
| CAUSES OF DEATH | Deaths | % | |
| 1. | Coronary Heart Disease |
3,299
|
14.07
|
| 2. | COVID-19 |
2,715
|
11.58
|
| 3. | Poisonings |
1,523
|
6.50
|
| 4. | Stroke |
1,439
|
6.14
|
| 5. | Lung Cancers |
1,351
|
5.76
|
| 6. | Lung Disease |
1,119
|
4.77
|
| 7. | Alzheimers |
1,048
|
4.47
|
| 8. | Hypertension |
926
|
3.95
|
| 9. | Diabetes Mellitus |
769
|
3.28
|
| 10. | Endocrine Disorders |
651
|
2.78
|
| 11. | Kidney Disease |
648
|
2.76
|
| 12. | Pancreas Cancer |
612
|
2.61
|
| 13. | Liver Disease |
550
|
2.35
|
| 14. | Falls |
512
|
2.18
|
| 15. | Colon-Rectum Cancers |
502
|
2.14
|
| 16. | Parkinson's Disease |
428
|
1.83
|
| 17. | Breast Cancer |
426
|
1.82
|
| 18. | Suicide |
396
|
1.69
|
| 19. | Influenza & Pneumonia |
394
|
1.68
|
| 20. | Prostate Cancer |
377
|
1.61
|
| 21. | Lymphomas |
365
|
1.56
|
| 22. | Road Traffic Accidents |
318
|
1.36
|
| 23. | Liver Cancer |
266
|
1.13
|
| 24. | Other Injuries |
252
|
1.08
|
| 25. | Inflammatory/Heart |
250
|
1.07
|
| CAUSES OF DEATH | Deaths | % | |
| 26. | Leukemia |
247
|
1.05
|
| 27. | Other Neoplasms |
223
|
0.95
|
| 28. | Bladder Cancer |
191
|
0.81
|
| 29. | Alcohol |
171
|
0.73
|
| 30. | Malnutrition |
164
|
0.70
|
| 31. | Oesophagus Cancer |
149
|
0.64
|
| 32. | Uterin Cancer |
138
|
0.59
|
| 33. | Homicide |
138
|
0.59
|
| 34. | Ovary Cancer |
131
|
0.56
|
| 35. | Skin Cancers |
119
|
0.51
|
| 36. | Stomach Cancer |
110
|
0.47
|
| 37. | Oral Cancer |
89
|
0.38
|
| 38. | Diarrhoeal diseases |
70
|
0.30
|
| 39. | Skin Disease |
55
|
0.23
|
| 40. | Congenital Anomalies |
51
|
0.22
|
| 41. | Multiple Sclerosis |
45
|
0.19
|
| 42. | Drug Use |
34
|
0.15
|
| 43. | Low Birth Weight |
32
|
0.14
|
| 44. | Anaemia |
31
|
0.13
|
| 45. | HIV/AIDS |
29
|
0.12
|
| 46. | Peptic Ulcer Disease |
26
|
0.11
|
| 47. | Birth Trauma |
16
|
0.07
|
| 48. | Epilepsy |
12
|
0.05
|
| 49. | Rheumatic/Heart |
12
|
0.05
|
| 50. | Hepatitis C |
10
|
0.04
|

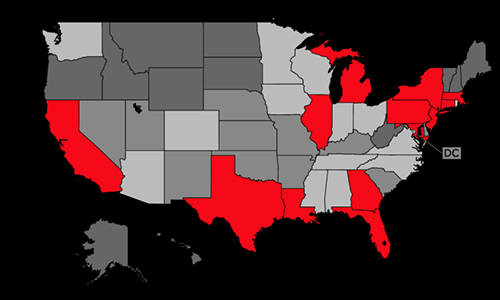
AGE-STANDARDIZED DEATH RATE: CDC 12/22
PER 100,000 POPULATION
GOOD
POOR
| Rate | USA Rank | ||
| 1. | Lung Cancers |
27.23
|
42
|
| 2. | Prostate Cancer |
18.86
|
37
|
| 3. | Breast Cancer |
15.63
|
48
|
| 4. | Pancreas Cancer |
12.54
|
7
|
| 5. | Colon-Rectum Cancers |
10.39
|
49
|
| 6. | Lymphomas |
7.86
|
45
|
| 7. | Leukemia |
5.69
|
37
|
| 8. | Liver Cancer |
5.38
|
42
|
| Rate | USA Rank | ||
| 9. | Uterin Cancer |
5.20
|
26
|
| 10. | Ovary Cancer |
4.95
|
48
|
| 11. | Bladder Cancer |
3.95
|
41
|
| 12. | Oesophagus Cancer |
3.28
|
41
|
| 13. | Skin Cancers |
2.68
|
42
|
| 14. | Stomach Cancer |
2.39
|
30
|
| 15. | Oral Cancer |
2.01
|
47
|
| 16. | Cervical Cancer |
1.98
|
25
|
DEATH RATE HISTORY SELECTED CAUSES

| Date | Rate | Total | Population |
| 1999 | 238.82 | 9,127 | 3,386,401 |
| 2000 | 232.72 | 8,993 | 3,405,565 |
| 2001 | 218.04 | 8,582 | 3,432,835 |
| 2002 | 219.25 | 8,815 | 3,458,749 |
| 2003 | 204.06 | 8,389 | 3,484,336 |
| 2004 | 189.54 | 7,868 | 3,496,094 |
| 2005 | 180.74 | 7,650 | 3,506,956 |
| 2006 | 174.72 | 7,490 | 3,517,460 |
| 2007 | 167.35 | 7,289 | 3,527,270 |
| 2008 | 165.60 | 7,355 | 3,545,579 |
| 2009 | 157.71 | 7,105 | 3,561,807 |
| 2010 | 155.69 | 7,127 | 3,574,097 |
| 2011 | 155.15 | 7,206 | 3,580,709 |
| 2012 | 155.29 | 7,282 | 3,590,347 |
| 2013 | 148.92 | 7,090 | 3,596,080 |
| 2014 | 145.64 | 7,018 | 3,596,677 |
| 2015 | 147.80 | 7,205 | 3,590,886 |
| 2016 | 144.33 | 7,051 | 3,576,452 |
| 2017 | 141.62 | 7,138 | 3,588,184 |
| 2018 | 142.14 | 7,205 | 3,572,665 |
| 2019 | 143.10 | 7,354 | 3,565,287 |
| 2020 | 138.40 | 7,110 | 3,557,006 |
| 2021 | 136.68 | 6,731 | 3,605,597 |

| Date | Rate | Total | Population |
| 1999 | 191.00 | 7,054 | 3,386,401 |
| 2000 | 189.54 | 7,065 | 3,405,565 |
| 2001 | 187.58 | 7,093 | 3,432,835 |
| 2002 | 186.34 | 7,163 | 3,458,749 |
| 2003 | 183.02 | 7,131 | 3,484,336 |
| 2004 | 182.41 | 7,175 | 3,496,094 |
| 2005 | 176.81 | 7,052 | 3,506,956 |
| 2006 | 175.46 | 7,044 | 3,517,460 |
| 2007 | 167.23 | 6,827 | 3,527,270 |
| 2008 | 164.75 | 6,830 | 3,545,579 |
| 2009 | 162.81 | 6,819 | 3,561,807 |
| 2010 | 163.37 | 6,954 | 3,574,097 |
| 2011 | 158.43 | 6,837 | 3,580,709 |
| 2012 | 151.95 | 6,681 | 3,590,347 |
| 2013 | 148.40 | 6,619 | 3,596,080 |
| 2014 | 146.71 | 6,621 | 3,596,677 |
| 2015 | 146.23 | 6,666 | 3,590,886 |
| 2016 | 144.90 | 6,696 | 3,576,452 |
| 2017 | 139.55 | 6,608 | 3,588,184 |
| 2018 | 134.12 | 6,472 | 3,572,665 |
| 2019 | 131.88 | 6,496 | 3,565,287 |
| 2020 | 133.80 | 6,638 | 3,557,006 |
| 2021 | 133.54 | 6,526 | 3,605,597 |

| Date | Rate | Total | Population |
| 1999 | 49.95 | 1,933 | 3,386,401 |
| 2000 | 51.43 | 2,011 | 3,405,565 |
| 2001 | 50.10 | 2,003 | 3,432,835 |
| 2002 | 46.03 | 1,861 | 3,458,749 |
| 2003 | 44.02 | 1,828 | 3,484,336 |
| 2004 | 39.13 | 1,635 | 3,496,094 |
| 2005 | 36.22 | 1,528 | 3,506,956 |
| 2006 | 35.78 | 1,547 | 3,517,460 |
| 2007 | 33.44 | 1,463 | 3,527,270 |
| 2008 | 32.00 | 1,433 | 3,545,579 |
| 2009 | 32.42 | 1,460 | 3,561,807 |
| 2010 | 29.39 | 1,349 | 3,574,097 |
| 2011 | 28.34 | 1,315 | 3,580,709 |
| 2012 | 27.03 | 1,273 | 3,590,347 |
| 2013 | 28.28 | 1,348 | 3,596,080 |
| 2014 | 26.28 | 1,266 | 3,596,677 |
| 2015 | 28.49 | 1,388 | 3,590,886 |
| 2016 | 26.32 | 1,269 | 3,576,452 |
| 2017 | 27.79 | 1,403 | 3,588,184 |
| 2018 | 27.20 | 1,388 | 3,572,665 |
| 2019 | 26.66 | 1,375 | 3,565,287 |
| 2020 | 28.40 | 1,467 | 3,557,006 |
| 2021 | 29.52 | 1,444 | 3,605,597 |

| Date | Rate | Total | Population |
| 1999 | 37.78 | 1,435 | 3,386,401 |
| 2000 | 40.09 | 1,533 | 3,405,565 |
| 2001 | 38.20 | 1,486 | 3,432,835 |
| 2002 | 36.91 | 1,453 | 3,458,749 |
| 2003 | 36.09 | 1,445 | 3,484,336 |
| 2004 | 35.38 | 1,432 | 3,496,094 |
| 2005 | 36.06 | 1,471 | 3,506,956 |
| 2006 | 34.97 | 1,458 | 3,517,460 |
| 2007 | 32.29 | 1,353 | 3,527,270 |
| 2008 | 35.34 | 1,505 | 3,545,579 |
| 2009 | 33.51 | 1,448 | 3,561,807 |
| 2010 | 29.37 | 1,289 | 3,574,097 |
| 2011 | 32.05 | 1,415 | 3,580,709 |
| 2012 | 30.94 | 1,387 | 3,590,347 |
| 2013 | 29.66 | 1,348 | 3,596,080 |
| 2014 | 30.19 | 1,368 | 3,596,677 |
| 2015 | 29.72 | 1,369 | 3,590,886 |
| 2016 | 30.48 | 1,425 | 3,576,452 |
| 2017 | 30.42 | 1,471 | 3,588,184 |
| 2018 | 28.90 | 1,427 | 3,572,665 |
| 2019 | 27.84 | 1,399 | 3,565,287 |
| 2020 | 24.40 | 1,236 | 3,557,006 |
| 2021 | 23.80 | 1,169 | 3,605,597 |

| Date | Rate | Total | Population |
| 1999 | 29.31 | 1,034 | 3,386,401 |
| 2000 | 32.81 | 1,175 | 3,405,565 |
| 2001 | 29.47 | 1,056 | 3,432,835 |
| 2002 | 32.51 | 1,182 | 3,458,749 |
| 2003 | 30.22 | 1,112 | 3,484,336 |
| 2004 | 33.95 | 1,261 | 3,496,094 |
| 2005 | 30.25 | 1,134 | 3,506,956 |
| 2006 | 34.55 | 1,302 | 3,517,460 |
| 2007 | 35.40 | 1,343 | 3,527,270 |
| 2008 | 35.69 | 1,386 | 3,545,579 |
| 2009 | 32.96 | 1,293 | 3,561,807 |
| 2010 | 33.59 | 1,337 | 3,574,097 |
| 2011 | 33.34 | 1,339 | 3,580,709 |
| 2012 | 34.65 | 1,392 | 3,590,347 |
| 2013 | 39.31 | 1,582 | 3,596,080 |
| 2014 | 40.92 | 1,641 | 3,596,677 |
| 2015 | 44.78 | 1,799 | 3,590,886 |
| 2016 | 50.35 | 1,978 | 3,576,452 |
| 2017 | 53.15 | 2,078 | 3,588,184 |
| 2018 | 53.14 | 2,054 | 3,572,665 |
| 2019 | 56.15 | 2,197 | 3,565,287 |
| 2020 | 63.52 | 2,447 | 3,557,006 |
| 2021 | 67.37 | 2,644 | 3,605,597 |

| Date | Rate | Total | Population |
| 1999 | 18.53 | 691 | 3,386,401 |
| 2000 | 18.10 | 683 | 3,405,565 |
| 2001 | 19.70 | 759 | 3,432,835 |
| 2002 | 17.27 | 675 | 3,458,749 |
| 2003 | 16.78 | 665 | 3,484,336 |
| 2004 | 19.05 | 767 | 3,496,094 |
| 2005 | 20.02 | 811 | 3,506,956 |
| 2006 | 18.98 | 782 | 3,517,460 |
| 2007 | 15.51 | 646 | 3,527,270 |
| 2008 | 14.72 | 624 | 3,545,579 |
| 2009 | 14.46 | 624 | 3,561,807 |
| 2010 | 15.43 | 662 | 3,574,097 |
| 2011 | 15.53 | 692 | 3,580,709 |
| 2012 | 14.16 | 631 | 3,590,347 |
| 2013 | 14.77 | 664 | 3,596,080 |
| 2014 | 14.95 | 685 | 3,596,677 |
| 2015 | 13.91 | 653 | 3,590,886 |
| 2016 | 14.89 | 699 | 3,576,452 |
| 2017 | 14.48 | 694 | 3,588,184 |
| 2018 | 14.58 | 708 | 3,572,665 |
| 2019 | 15.61 | 761 | 3,565,287 |
| 2020 | 17.55 | 861 | 3,557,006 |
| 2021 | 15.95 | 770 | 3,605,597 |

| Date | Rate | Total | Population |
| 1999 | 11.40 | 449 | 3,386,401 |
| 2000 | 13.13 | 526 | 3,405,565 |
| 2001 | 14.02 | 573 | 3,432,835 |
| 2002 | 13.60 | 570 | 3,458,749 |
| 2003 | 14.19 | 612 | 3,484,336 |
| 2004 | 15.73 | 684 | 3,496,094 |
| 2005 | 17.40 | 777 | 3,506,956 |
| 2006 | 15.97 | 728 | 3,517,460 |
| 2007 | 16.55 | 764 | 3,527,270 |
| 2008 | 17.81 | 839 | 3,545,579 |
| 2009 | 16.33 | 778 | 3,561,807 |
| 2010 | 17.09 | 820 | 3,574,097 |
| 2011 | 16.42 | 813 | 3,580,709 |
| 2012 | 16.78 | 842 | 3,590,347 |
| 2013 | 16.23 | 824 | 3,596,080 |
| 2014 | 18.42 | 923 | 3,596,677 |
| 2015 | 19.04 | 966 | 3,590,886 |
| 2016 | 20.29 | 1,035 | 3,576,452 |
| 2017 | 20.40 | 1,077 | 3,588,184 |
| 2018 | 18.53 | 986 | 3,572,665 |
| 2019 | 18.09 | 967 | 3,565,287 |
| 2020 | 20.29 | 1,084 | 3,557,006 |
| 2021 | 21.24 | 1,049 | 3,605,597 |

| Date | Rate | Total | Population |
| 1999 | 22.66 | 885 | 3,386,401 |
| 2000 | 22.50 | 890 | 3,405,565 |
| 2001 | 21.14 | 854 | 3,432,835 |
| 2002 | 21.45 | 888 | 3,458,749 |
| 2003 | 20.47 | 860 | 3,484,336 |
| 2004 | 20.30 | 868 | 3,496,094 |
| 2005 | 21.86 | 956 | 3,506,956 |
| 2006 | 18.17 | 800 | 3,517,460 |
| 2007 | 17.22 | 776 | 3,527,270 |
| 2008 | 15.08 | 694 | 3,545,579 |
| 2009 | 15.36 | 696 | 3,561,807 |
| 2010 | 12.09 | 568 | 3,574,097 |
| 2011 | 14.58 | 696 | 3,580,709 |
| 2012 | 11.78 | 558 | 3,590,347 |
| 2013 | 12.20 | 604 | 3,596,080 |
| 2014 | 13.32 | 644 | 3,596,677 |
| 2015 | 13.60 | 667 | 3,590,886 |
| 2016 | 11.71 | 572 | 3,576,452 |
| 2017 | 13.09 | 675 | 3,588,184 |
| 2018 | 14.81 | 757 | 3,572,665 |
| 2019 | 11.01 | 563 | 3,565,287 |
| 2020 | 10.26 | 527 | 3,557,006 |
| 2021 | 8.26 | 406 | 3,605,597 |

| Date | Rate | Total | Population |
| 1999 | 12.13 | 457 | 3,386,401 |
| 2000 | 13.64 | 524 | 3,405,565 |
| 2001 | 15.07 | 585 | 3,432,835 |
| 2002 | 13.97 | 554 | 3,458,749 |
| 2003 | 13.97 | 567 | 3,484,336 |
| 2004 | 14.80 | 604 | 3,496,094 |
| 2005 | 13.71 | 580 | 3,506,956 |
| 2006 | 13.46 | 567 | 3,517,460 |
| 2007 | 13.15 | 566 | 3,527,270 |
| 2008 | 13.47 | 589 | 3,545,579 |
| 2009 | 13.30 | 585 | 3,561,807 |
| 2010 | 13.41 | 599 | 3,574,097 |
| 2011 | 13.11 | 602 | 3,580,709 |
| 2012 | 12.39 | 569 | 3,590,347 |
| 2013 | 11.92 | 565 | 3,596,080 |
| 2014 | 12.91 | 605 | 3,596,677 |
| 2015 | 12.12 | 584 | 3,590,886 |
| 2016 | 12.10 | 570 | 3,576,452 |
| 2017 | 11.22 | 554 | 3,588,184 |
| 2018 | 12.18 | 612 | 3,572,665 |
| 2019 | 12.65 | 643 | 3,565,287 |
| 2020 | 10.91 | 555 | 3,557,006 |
| 2021 | 12.93 | 638 | 3,605,597 |

| Date | Rate | Total | Population |
| 1999 | 12.89 | 490 | 3,386,401 |
| 2000 | 13.98 | 537 | 3,405,565 |
| 2001 | 14.19 | 552 | 3,432,835 |
| 2002 | 13.24 | 527 | 3,458,749 |
| 2003 | 15.76 | 630 | 3,484,336 |
| 2004 | 12.77 | 516 | 3,496,094 |
| 2005 | 14.93 | 614 | 3,506,956 |
| 2006 | 13.95 | 585 | 3,517,460 |
| 2007 | 14.43 | 609 | 3,527,270 |
| 2008 | 13.50 | 575 | 3,545,579 |
| 2009 | 13.18 | 575 | 3,561,807 |
| 2010 | 13.58 | 595 | 3,574,097 |
| 2011 | 12.78 | 565 | 3,580,709 |
| 2012 | 11.88 | 544 | 3,590,347 |
| 2013 | 12.57 | 575 | 3,596,080 |
| 2014 | 12.56 | 578 | 3,596,677 |
| 2015 | 13.66 | 646 | 3,590,886 |
| 2016 | 12.52 | 588 | 3,576,452 |
| 2017 | 12.61 | 619 | 3,588,184 |
| 2018 | 11.55 | 574 | 3,572,665 |
| 2019 | 12.16 | 606 | 3,565,287 |
| 2020 | 10.94 | 552 | 3,557,006 |
| 2021 | 11.95 | 574 | 3,605,597 |

| Date | Rate | Total | Population |
| 1999 | 7.94 | 274 | 3,386,401 |
| 2000 | 8.75 | 304 | 3,405,565 |
| 2001 | 8.12 | 283 | 3,432,835 |
| 2002 | 7.33 | 260 | 3,458,749 |
| 2003 | 7.54 | 272 | 3,484,336 |
| 2004 | 8.15 | 294 | 3,496,094 |
| 2005 | 8.11 | 295 | 3,506,956 |
| 2006 | 7.98 | 292 | 3,517,460 |
| 2007 | 7.33 | 271 | 3,527,270 |
| 2008 | 8.47 | 315 | 3,545,579 |
| 2009 | 8.49 | 316 | 3,561,807 |
| 2010 | 9.35 | 353 | 3,574,097 |
| 2011 | 9.82 | 370 | 3,580,709 |
| 2012 | 9.86 | 368 | 3,590,347 |
| 2013 | 8.74 | 330 | 3,596,080 |
| 2014 | 9.78 | 379 | 3,596,677 |
| 2015 | 9.85 | 384 | 3,590,886 |
| 2016 | 10.11 | 397 | 3,576,452 |
| 2017 | 10.51 | 405 | 3,588,184 |
| 2018 | 10.58 | 419 | 3,572,665 |
| 2019 | 11.36 | 435 | 3,565,287 |
| 2020 | 9.33 | 364 | 3,557,006 |
| 2021 | 9.98 | 401 | 3,605,597 |

| Date | Rate | Total | Population |
| 1999 | 6.24 | 239 | 3,386,401 |
| 2000 | 6.14 | 240 | 3,405,565 |
| 2001 | 6.41 | 252 | 3,432,835 |
| 2002 | 6.33 | 256 | 3,458,749 |
| 2003 | 7.10 | 291 | 3,484,336 |
| 2004 | 7.51 | 313 | 3,496,094 |
| 2005 | 7.75 | 330 | 3,506,956 |
| 2006 | 7.13 | 311 | 3,517,460 |
| 2007 | 6.80 | 300 | 3,527,270 |
| 2008 | 7.08 | 319 | 3,545,579 |
| 2009 | 7.67 | 346 | 3,561,807 |
| 2010 | 6.98 | 321 | 3,574,097 |
| 2011 | 6.70 | 316 | 3,580,709 |
| 2012 | 5.95 | 287 | 3,590,347 |
| 2013 | 7.75 | 374 | 3,596,080 |
| 2014 | 7.27 | 356 | 3,596,677 |
| 2015 | 6.38 | 317 | 3,590,886 |
| 2016 | 6.39 | 318 | 3,576,452 |
| 2017 | 6.98 | 366 | 3,588,184 |
| 2018 | 7.47 | 387 | 3,572,665 |
| 2019 | 6.25 | 330 | 3,565,287 |
| 2020 | 7.45 | 390 | 3,557,006 |
| 2021 | 6.64 | 328 | 3,605,597 |

| Date | Rate | Total | Population |
| 1999 | 8.38 | 301 | 3,386,401 |
| 2000 | 9.22 | 333 | 3,405,565 |
| 2001 | 7.99 | 294 | 3,432,835 |
| 2002 | 8.48 | 318 | 3,458,749 |
| 2003 | 8.38 | 319 | 3,484,336 |
| 2004 | 7.64 | 293 | 3,496,094 |
| 2005 | 7.19 | 283 | 3,506,956 |
| 2006 | 6.94 | 273 | 3,517,460 |
| 2007 | 7.19 | 288 | 3,527,270 |
| 2008 | 7.30 | 298 | 3,545,579 |
| 2009 | 7.25 | 301 | 3,561,807 |
| 2010 | 7.27 | 303 | 3,574,097 |
| 2011 | 7.30 | 312 | 3,580,709 |
| 2012 | 7.82 | 334 | 3,590,347 |
| 2013 | 7.74 | 336 | 3,596,080 |
| 2014 | 8.51 | 375 | 3,596,677 |
| 2015 | 8.35 | 365 | 3,590,886 |
| 2016 | 8.55 | 388 | 3,576,452 |
| 2017 | 9.13 | 407 | 3,588,184 |
| 2018 | 7.62 | 350 | 3,572,665 |
| 2019 | 8.91 | 418 | 3,565,287 |
| 2020 | 12.37 | 543 | 3,557,006 |
| 2021 | 12.24 | 550 | 3,605,597 |

| Date | Rate | Total | Population |
| 1999 | 4.67 | 181 | 3,386,401 |
| 2000 | 5.16 | 203 | 3,405,565 |
| 2001 | 5.43 | 214 | 3,432,835 |
| 2002 | 4.95 | 200 | 3,458,749 |
| 2003 | 5.46 | 225 | 3,484,336 |
| 2004 | 5.70 | 236 | 3,496,094 |
| 2005 | 5.65 | 239 | 3,506,956 |
| 2006 | 6.16 | 264 | 3,517,460 |
| 2007 | 6.21 | 267 | 3,527,270 |
| 2008 | 5.84 | 256 | 3,545,579 |
| 2009 | 5.61 | 250 | 3,561,807 |
| 2010 | 5.27 | 237 | 3,574,097 |
| 2011 | 6.39 | 284 | 3,580,709 |
| 2012 | 5.48 | 246 | 3,590,347 |
| 2013 | 6.03 | 279 | 3,596,080 |
| 2014 | 6.35 | 294 | 3,596,677 |
| 2015 | 7.19 | 334 | 3,590,886 |
| 2016 | 7.65 | 358 | 3,576,452 |
| 2017 | 7.14 | 350 | 3,588,184 |
| 2018 | 8.20 | 403 | 3,572,665 |
| 2019 | 7.17 | 362 | 3,565,287 |
| 2020 | 8.28 | 420 | 3,557,006 |
| 2021 | 9.02 | 436 | 3,605,597 |

| Date | Rate | Total | Population |
| 1999 | 3.65 | 120 | 3,386,401 |
| 2000 | 2.89 | 95 | 3,405,565 |
| 2001 | 5.08 | 172 | 3,432,835 |
| 2002 | 2.99 | 98 | 3,458,749 |
| 2003 | 3.13 | 107 | 3,484,336 |
| 2004 | 3.30 | 110 | 3,496,094 |
| 2005 | 3.22 | 107 | 3,506,956 |
| 2006 | 3.94 | 132 | 3,517,460 |
| 2007 | 3.10 | 106 | 3,527,270 |
| 2008 | 3.79 | 127 | 3,545,579 |
| 2009 | 3.45 | 114 | 3,561,807 |
| 2010 | 4.19 | 144 | 3,574,097 |
| 2011 | 4.05 | 135 | 3,580,709 |
| 2012 | 4.41 | 152 | 3,590,347 |
| 2013 | 2.93 | 100 | 3,596,080 |
| 2014 | 2.86 | 100 | 3,596,677 |
| 2015 | 3.61 | 124 | 3,590,886 |
| 2016 | 2.66 | 88 | 3,576,452 |
| 2017 | 3.21 | 109 | 3,588,184 |
| 2018 | 2.75 | 92 | 3,572,665 |
| 2019 | 3.13 | 106 | 3,565,287 |
| 2020 | 4.61 | 152 | 3,557,006 |
| 2021 | 4.79 | 160 | 3,605,597 |
CHOOSE NEW STATE
COVID-19 UPDATE
4/1/24
| CASES | DEATHS |
|
983,652
|
12,354
|
COVID-19 DEATH SIMULATOR
Current Covid-19 deaths compared to a simulated calendar based historical average of selected Connecticut causes.

WITH STATE ADJUSTMENTS

WITH STATE ADJUSTMENTS

WITH STATE ADJUSTMENTS
Centers for Disease Control and Prevention: Final Deaths 2021 Release Date 12/22.


